GPT Image 23:2
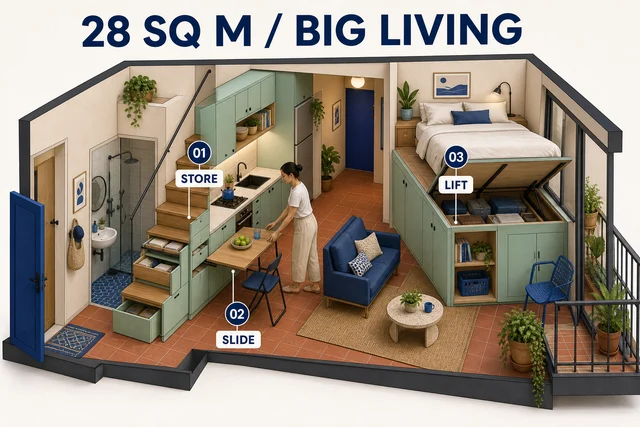
Micro Apartment Cutaway
Reveal a compact home through one coherent cutaway, three storage moves, and an honest circulation path.
View prompt ↗ Retake Design
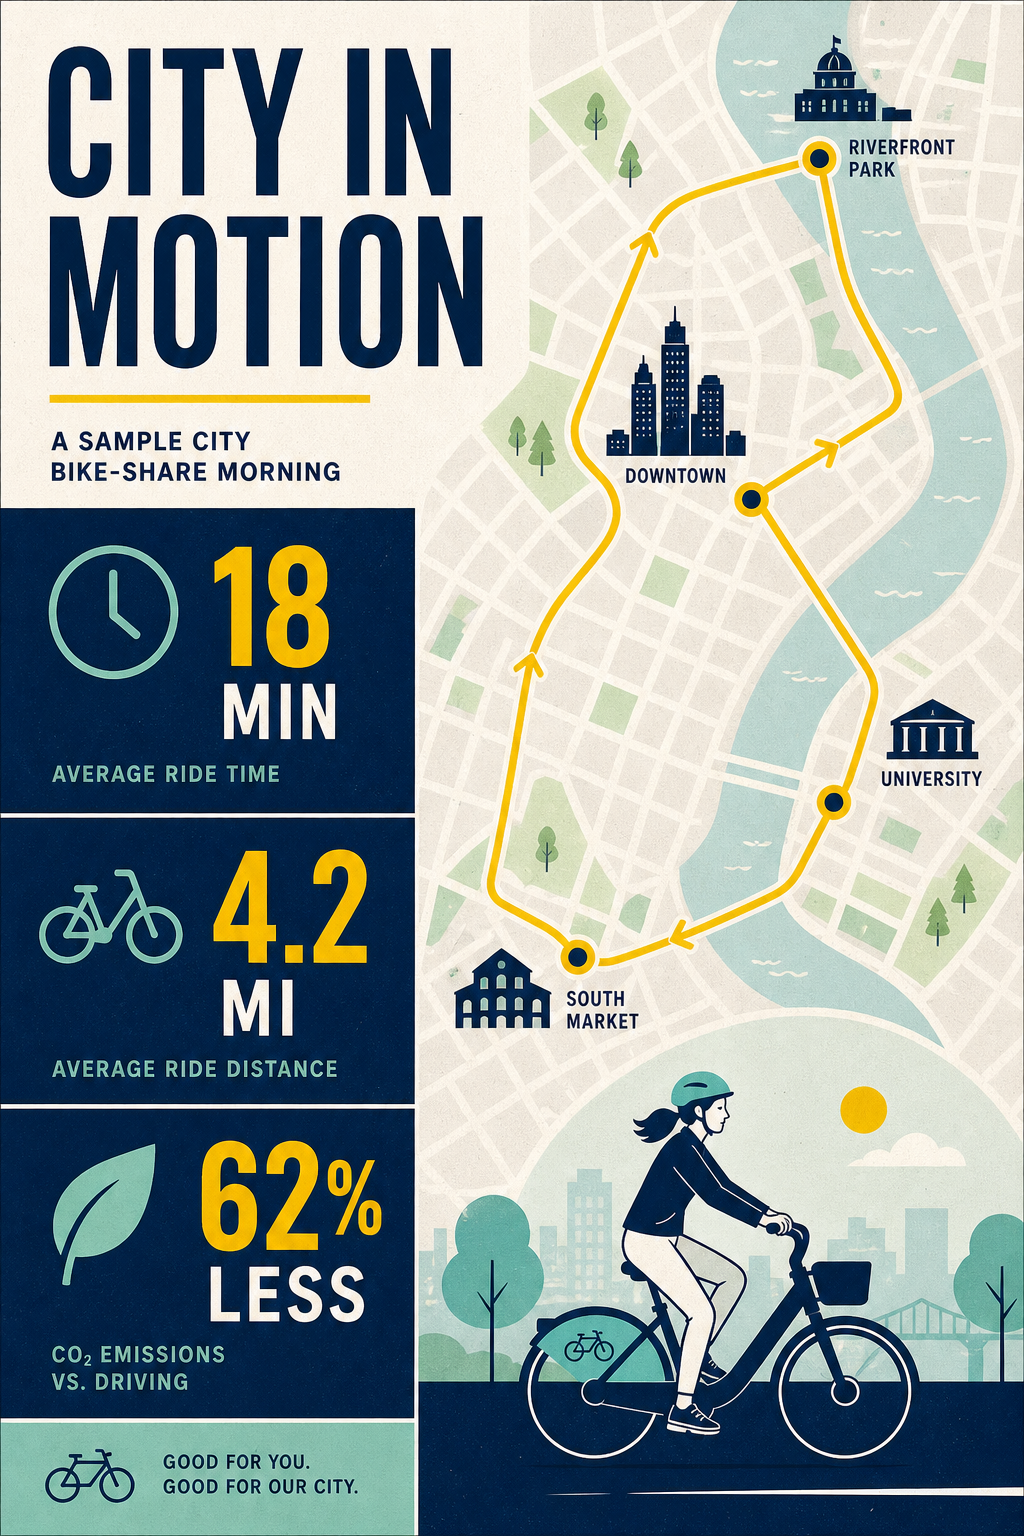
Turn mobility facts into a polished editorial infographic with maps, charts, icons, and one narrative path.
Complete prompt
Design a vertical 2:3 editorial infographic titled exactly "CITY IN MOTION" about a sample city bike-share morning. Use a simplified stylized street map, a looping route line, three clear statistic modules reading exactly "18 MIN", "4.2 MI", and "62% LESS", plus small bicycle, clock, and leaf icons. Palette: deep navy, mint, warm white, and signal yellow. Combine Swiss editorial grid discipline with friendly civic wayfinding. Make the hierarchy immediately scannable, numbers large and accurate, labels minimal, vector-clean with subtle paper grain. No real municipal logo, no extra statistics, no tiny gibberish, no watermark.
Original Retake direction
The subject, composition, copy, variables, and visual system are original Retake content. Every preview was generated as an original Retake Catalog asset during catalog preparation and reviewed against this exact prompt. These previews do not claim output from the target model. Source and license observations remain recorded in the internal Catalog for review.
More GPT Image 2 prompts
View the full collection →